How to use Kanban analytics to find bottlenecks, overdue work, and workload issues
A Kanban board shows what is happening. Analytics show what is going wrong, and why, while there is still time to act. If you already run boards, the data they produce can warn you about problems days or weeks before a deadline is missed. This article covers practical lenses: bottlenecks, overdue work, stuck tasks, workload, due-date patterns, board comparison, and throughput.
New to boards? Start with how to set up a Kanban board, then come back — good analytics depend on cards that have owners, due dates, and labels.
In Otper, these signals live in reports and insights that signed-in users can review based on their team and board access. The exact numbers depend on your boards and filters, so treat the examples below as ways of reading your own work rather than a promise of the same results for every team.
Bottlenecks: where work quietly gets stuck
A bottleneck is the stage that limits how fast everything else can move. The symptom is simple: cards accumulate in one list, often Review or QA, while earlier stages keep feeding it. On a busy board this is easy to miss day to day, which is why looking at list distribution — how many cards sit in each stage over time — is so useful. A stage that keeps growing is your constraint.
Once you can see it, the fix is usually one of three: move people to the clogged stage, add a work-in-progress limit upstream so it stops overfilling, or split the stage into smaller steps. A list breakdown in your reporting makes this concrete rather than anecdotal.
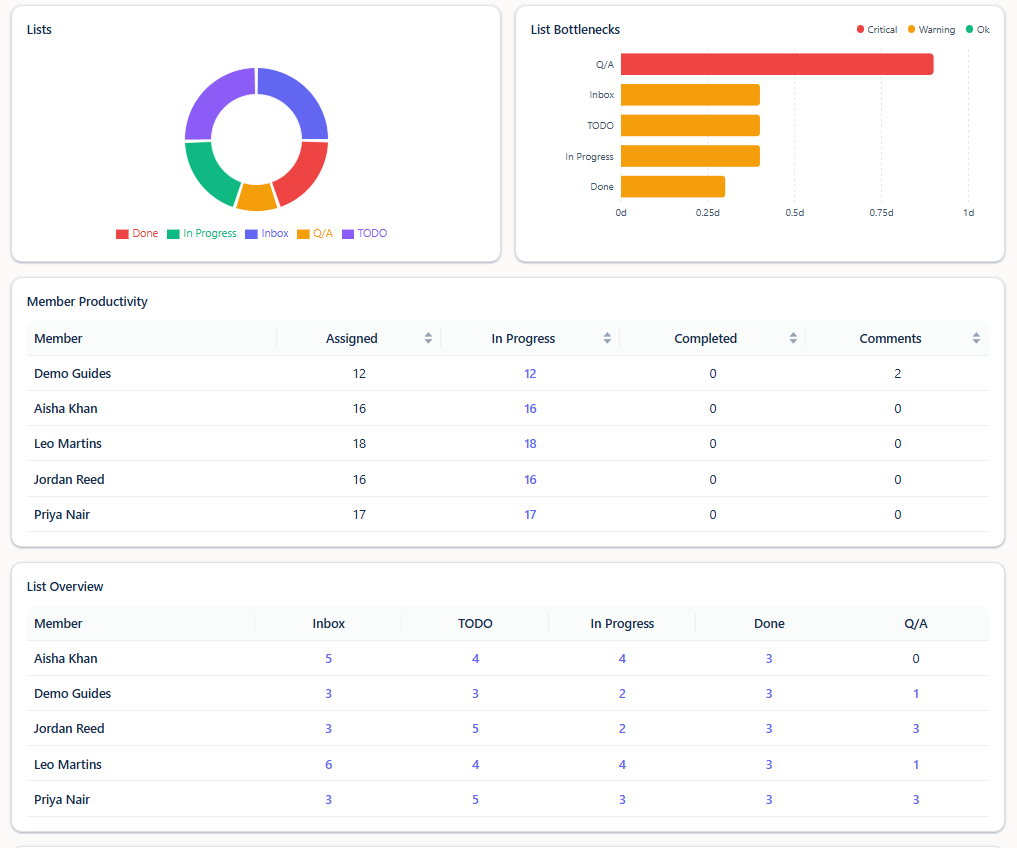
Stuck tasks: work that has gone quiet
Not every risk is overdue yet. Some cards simply stop moving or stop receiving meaningful updates. Stuck-task detection helps teams notice work that has been inactive long enough to deserve attention. That gives managers and owners a gentler intervention point: ask what is blocked, clarify the next step, or close the card if the work is no longer active.
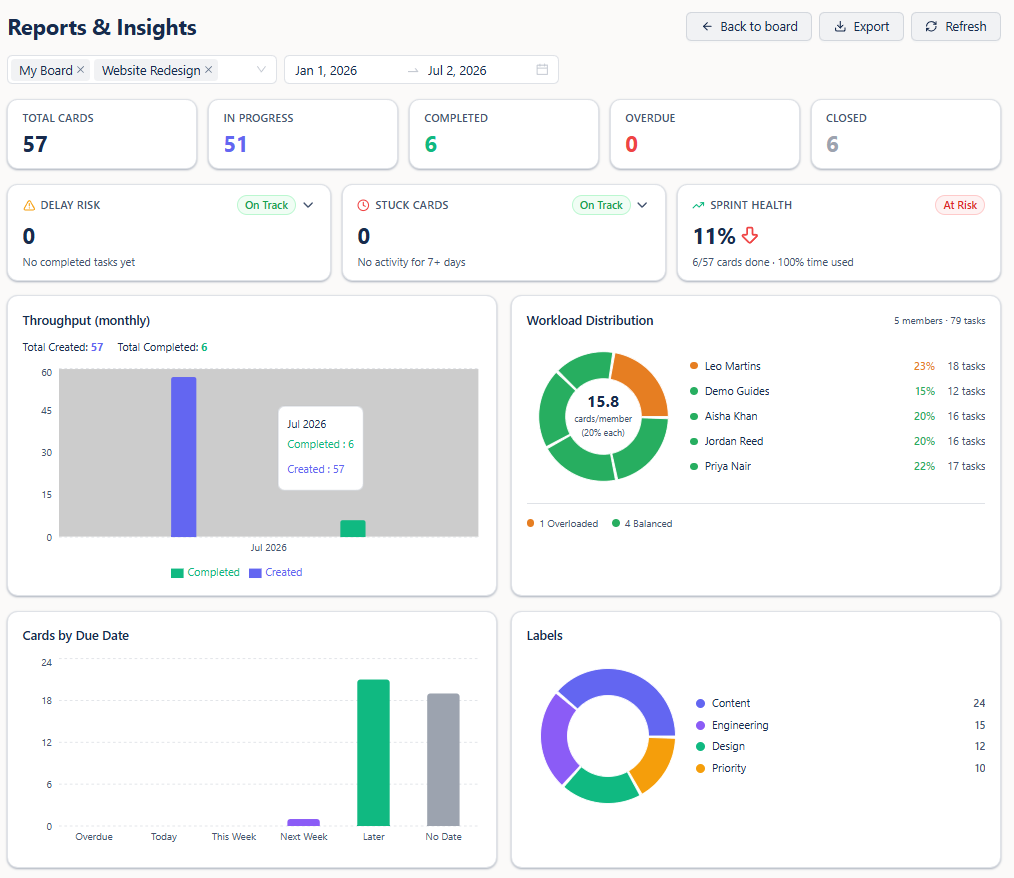
Overdue work: your deadline early-warning system
Overdue cards are a lagging indicator — by the time a card is late, the cause is usually upstream. The value is in the pattern, not the individual miss. Ask whether overdue cards cluster around the same owner, the same list, or the same workstream. If they do, you have found something you can fix: an overloaded person, a stage that always slips, or a project that was under-scoped.
A quick scan of overdue cards each week takes only minutes. Acting on the pattern — rebalancing work or renegotiating scope — is what keeps a single late card from becoming a late release.
Workload: protecting the team from imbalance
One of the most expensive problems on a busy team is invisible: a few people are overloaded while others have slack. Left unchecked it leads to burnout and single points of failure. A workload view — open and assigned cards per member, along with what is due soon — makes the imbalance visible so you can redistribute before a sprint starts, not after it fails.
A workload view that shows how many cards each member is carrying, and when their work is due, makes the imbalance easy to catch. For remote and cross-project teams especially, this is often the difference between a sustainable pace and a quiet overload no one flagged.
Throughput: is completion keeping up with intake?
Throughput compares how much work is created and completed during a period. If the team creates far more cards than it completes, the board is accumulating future pressure. If completed work drops while intake stays steady, look back at bottlenecks, workload, overdue cards, and stuck tasks to understand what changed.
Tracking throughput over time helps teams set commitments they can actually keep. It also gives you a practical way to evaluate process changes, such as adding capacity to a review stage or reassigning overloaded work.
Due-date patterns: seeing the crunch coming
Analytics are not only about the past. A cluster of due dates falling in the same week is a crunch you can see coming and plan around — move non-critical work, or add capacity in advance. Recurring slippage on one workstream points to an estimation or capacity problem worth addressing at the source. Otper due-date views and reporting make these patterns visible before they turn into a scramble.
Comparing boards across projects
If your team runs several projects, the question shifts from “what is stuck on this board?” to “which board needs attention first?” Comparing boards by total cards, created work, completed work, overdue work, closed cards, and active members helps you spend attention where the data says it matters, rather than on whichever project is loudest that week.
Turn it into a weekly habit
None of this requires a data analyst. A short weekly review is enough: scan bottlenecks, then overdue work, then stuck tasks, workload, and throughput — and commit to one change. Measure whether it helped the following week. Reviewed this way, a board stops being just a place to track tasks and becomes a tool for making better project decisions. Analytics are only as trustworthy as the board underneath them, so if the numbers look off, revisit how your board is set up — owners, due dates, and clear stages are what make the data mean something.
FAQ
What are Kanban analytics?
Metrics derived from your board, such as throughput, overdue counts, workload, due-date distribution, stuck tasks, and list bottlenecks, used to diagnose problems in how work flows.
How do I spot a bottleneck on a Kanban board?
Watch for a stage where cards keep accumulating over time. The stage that keeps growing is the constraint limiting your flow.
What is throughput in a project report?
Throughput compares how much work was created and completed in a period, helping teams see whether delivery is keeping up with intake.
How can analytics reduce overdue work?
By revealing patterns, such as a clogged stage or an overloaded owner, early enough to rebalance work before deadlines slip.
How often should I review Kanban reports?
A short weekly review is enough for most teams: check bottlenecks, overdue work, stuck tasks, workload, and throughput, then make one change.
Related guides
See where your work is getting stuck
Open your board’s reports in Otper and start with one question: where is work getting stuck this week?
Get started with Otper